Introduction: Unveiling India’s Diverse Economic Tapestry 🌟
India, a land of vibrant cultures and diverse landscapes, is also an economic mosaic. Its 28 states and 8 Union Territories each contribute uniquely to the nation’s burgeoning economy, painting a complex picture of development, disparity, and dynamic growth. As we step into 2025, a critical examination of these regional economies is not just an academic exercise but a vital tool for policymakers, investors, and citizens alike. Understanding the nuances of each state’s performance across key indicators like Gross Domestic Product (GDP), literacy rates, per-capita income, and population trends is paramount to comprehending India’s overall trajectory.
This comprehensive guide will deep-dive into the latest available data and projections for Indian States Economic Comparison 2025. We will analyze statistical information, use insightful graphs, and illustrate geographical variations with maps, providing a clearer perspective on which states are leading the charge and where significant development challenges persist. Join us as we unravel the economic fabric of India, state by state, metric by metric.
💡 AI + Data Note:
In 2025 the story behind these numbers is increasingly about data, AI and digital governance. From AI-powered crop advisories to predictive infrastructure planning, artificial intelligence is helping states extract more value from the same resources. This article now highlights not only the economic metrics but also the AI tools and digital policies accelerating growth across Indian states.
The Giants & The Growers – State GDP Overview 📊
The Gross Domestic Product (GDP) of a state is often considered the most important indicator of its economic size and health. It represents the total monetary value of all finished goods and services produced within its borders over a specific period. For Indian States Economic Comparison 2025, analyzing GDP gives us a clear hierarchy of economic powerhouses and emerging economies.
Understanding State GDP (GSDP)
Unlike national GDP, we refer to it as Gross State Domestic Product (GSDP). GSDP measures the value of goods and services produced within a state, without duplication. It’s a crucial metric for understanding a state’s contribution to the national economy and its internal economic dynamism. A higher GSDP often correlates with more industrial activity, robust service sectors, and greater overall economic output.
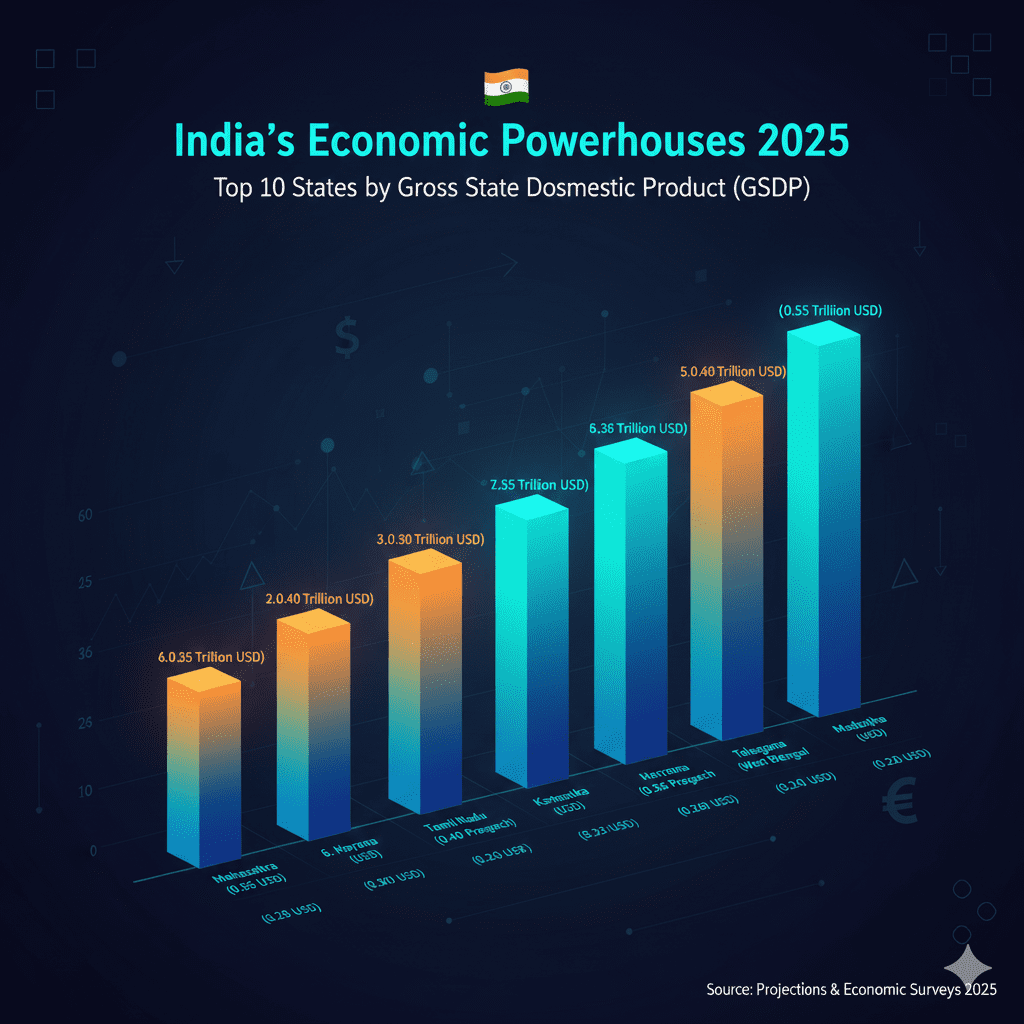
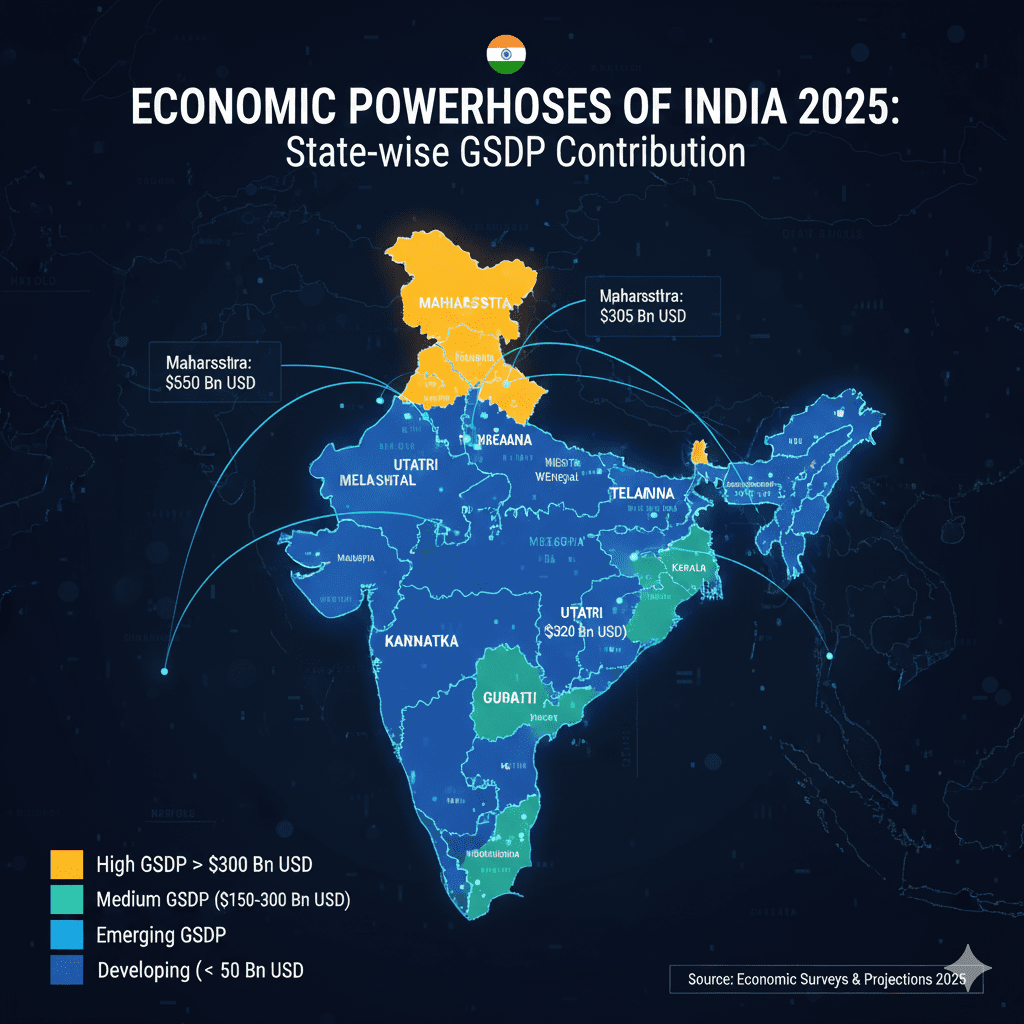
India’s Economic Powerhouses: Top States by GDP 🚀
As of 2025 projections, certain states continue to dominate India’s economic landscape due to their industrial bases, favorable policies, and strategic locations. These states are not just economic engines for themselves but also significant contributors to India’s ambition of becoming a $5 trillion economy.
Expected Leaders for 2025:
- Maharashtra: Often considered the financial capital of India, Maharashtra’s robust manufacturing, booming services sector (IT, finance, entertainment), and major port cities (Mumbai, Pune) ensure its perennial top position.
- Tamil Nadu: Known for its strong manufacturing base, particularly in automobiles, textiles, and electronics, alongside a burgeoning IT and services sector.
- Uttar Pradesh: Despite being historically agrarian, UP’s sheer size, improving infrastructure, and focused industrial policies are propelling it rapidly up the rankings. Its vast population also contributes significantly to demand.
- Karnataka: The Silicon Valley of India, driven by its unparalleled IT and biotechnology industries in Bengaluru, maintains a high growth trajectory.
- Gujarat: A manufacturing hub with strong industrial policies, port-led development, and a conducive business environment.
Emerging Economic Hubs: States to Watch 📈
Beyond the top five, several other states are showing impressive growth rates and are expected to make significant strides in their GSDP rankings by 2025. These include states that are aggressively pursuing industrialization, improving ease of doing business, and attracting domestic and foreign investments. States like Haryana, Telangana, and Madhya Pradesh are consistently demonstrating high growth, diversifying their economies beyond agriculture.
Factors Influencing State GDP
- Industrialization & Manufacturing: States with well-established industrial corridors and manufacturing hubs (e.g., Gujarat, Tamil Nadu, Maharashtra) tend to have higher GSDP.
- Services Sector: The growth of IT, finance, healthcare, and other services significantly boosts GSDP, particularly in states like Karnataka and Maharashtra.
- Infrastructure Development: Roads, ports, airports, and reliable power supply are critical for attracting investment and facilitating economic activity.
- Government Policies & Ease of Doing Business: Pro-business policies, single-window clearances, and incentives play a huge role in attracting both domestic and foreign investment.
- Human Capital: A skilled and educated workforce is essential for driving innovation and productivity across sectors.
External Link: For more detailed statistics on current GSDP and economic surveys, refer to the Ministry of Statistics and Programme Implementation (MoSPI): https://mospi.gov.in/
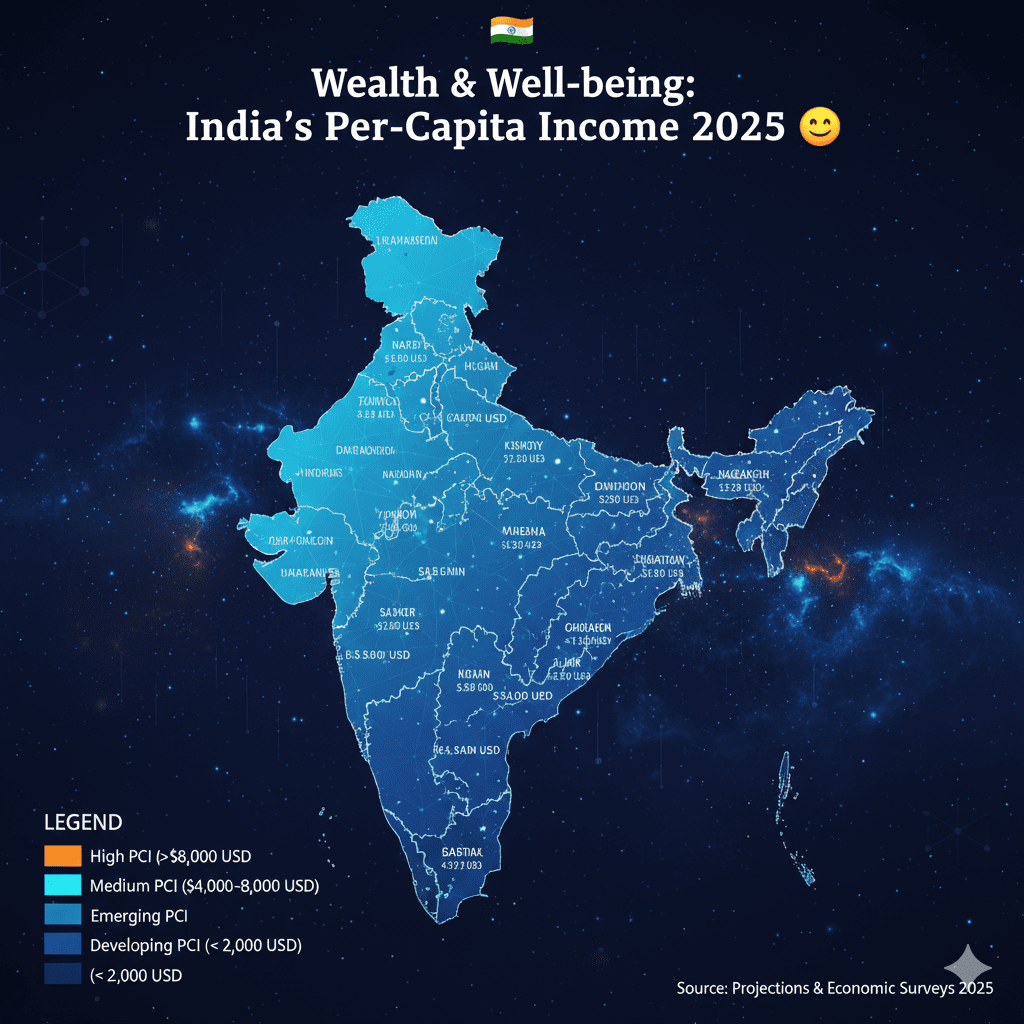
Wealth & Well-being – Per-Capita Income Insights 💰
While GDP offers a macro view of a state’s economy, Per-Capita Income in Indian States 2025 provides a more granular understanding of the average prosperity of its citizens. This metric is derived by dividing the total GSDP by the state’s population, offering insights into the standard of living and purchasing power.
Understanding Per-Capita Income (PCI)
Per-Capita Income (PCI) is a crucial indicator of economic development and the distribution of wealth. It tells us how much income each individual in a state would have if the total income were divided equally among the population. States with higher PCI typically have better social indicators, including health, education, and access to amenities.
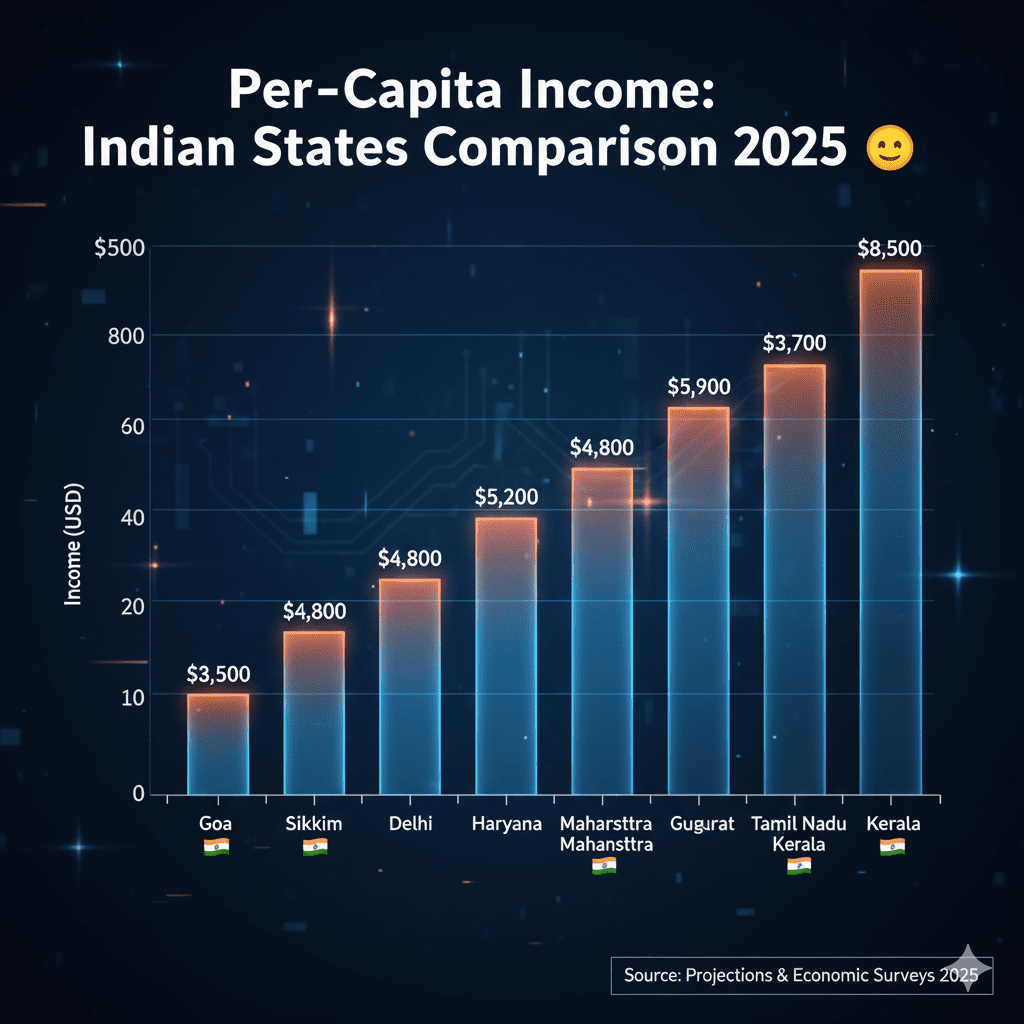
Leading States in Per-Capita Income 💵
It’s important to note that states with high GSDP don’t always top the charts for PCI if they also have a very large population. Smaller states or Union Territories with specialized, high-value industries often lead in PCI due to a smaller population base sharing a significant economic output.
Expected Leaders for 2025:
- Goa: Perennially at the top, driven by tourism, mining, and a relatively small population.
- Sikkim: Benefiting from tourism, hydroelectric power, and organic farming with a very small population.
- Delhi: As a Union Territory and the national capital, Delhi benefits from a strong services sector, high employment, and concentrated economic activity.
- Haryana: A prominent agricultural and industrial state in Northern India, benefiting from its proximity to Delhi and significant industrial investments.
- Karnataka/Maharashtra: These large economic powerhouses also perform well in PCI, driven by high-value IT and service sectors, despite their larger populations.
🧠 AI Insight:
Modern beneficiary validation for farmer transfers increasingly uses AI-backed verification and geospatial checks to prevent duplicate claims and speed DBT payments.
Bridging the Income Gap: Challenges & Opportunities
Significant disparities exist in per-capita income across Indian states, highlighting the challenge of inclusive growth. States with lower PCI often face issues like:
- Agrarian Dependence: Heavily reliant on agriculture, which is susceptible to weather fluctuations and often yields lower income per person.
- Lack of Industrialization: Limited manufacturing and service sector growth reduces high-paying job opportunities.
- Low Human Development Indicators: Lower literacy rates and health outcomes can hinder productivity and economic participation.
- Infrastructure Deficiencies: Poor connectivity and lack of basic amenities impede economic activity.
Government initiatives focusing on industrial corridors, skill development, and improving agricultural productivity are crucial for uplifting states with lower PCI.
External Link: For current data on Per-Capita Income (PCI) and related economic indicators by state, refer to the Reserve Bank of India (RBI) publications and reports: https://www.rbi.org.in/
The Foundation of Progress – Literacy Rates 📚
Education is the bedrock of development, and literacy rates are a fundamental indicator of a state’s human capital. In our Indian States Economic Comparison 2025, analyzing literacy provides crucial context for understanding future economic potential, innovation, and social mobility. A higher literacy rate typically correlates with higher productivity, better health outcomes, and greater civic engagement.
Understanding Literacy Rates
Literacy rate is defined as the percentage of the population aged 7 and above who can read and write with understanding. It’s a key component of the Human Development Index (HDI) and reflects the effectiveness of a state’s education system and its commitment to social progress.
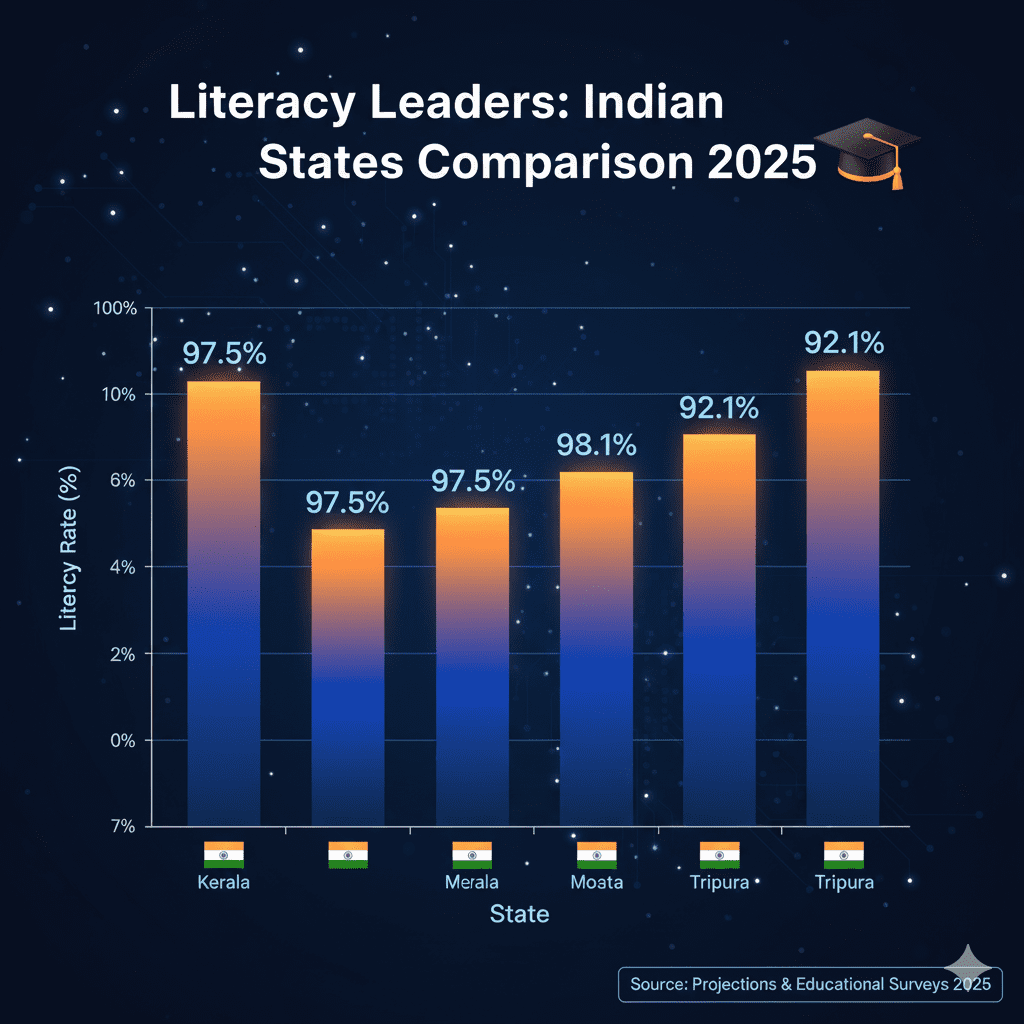
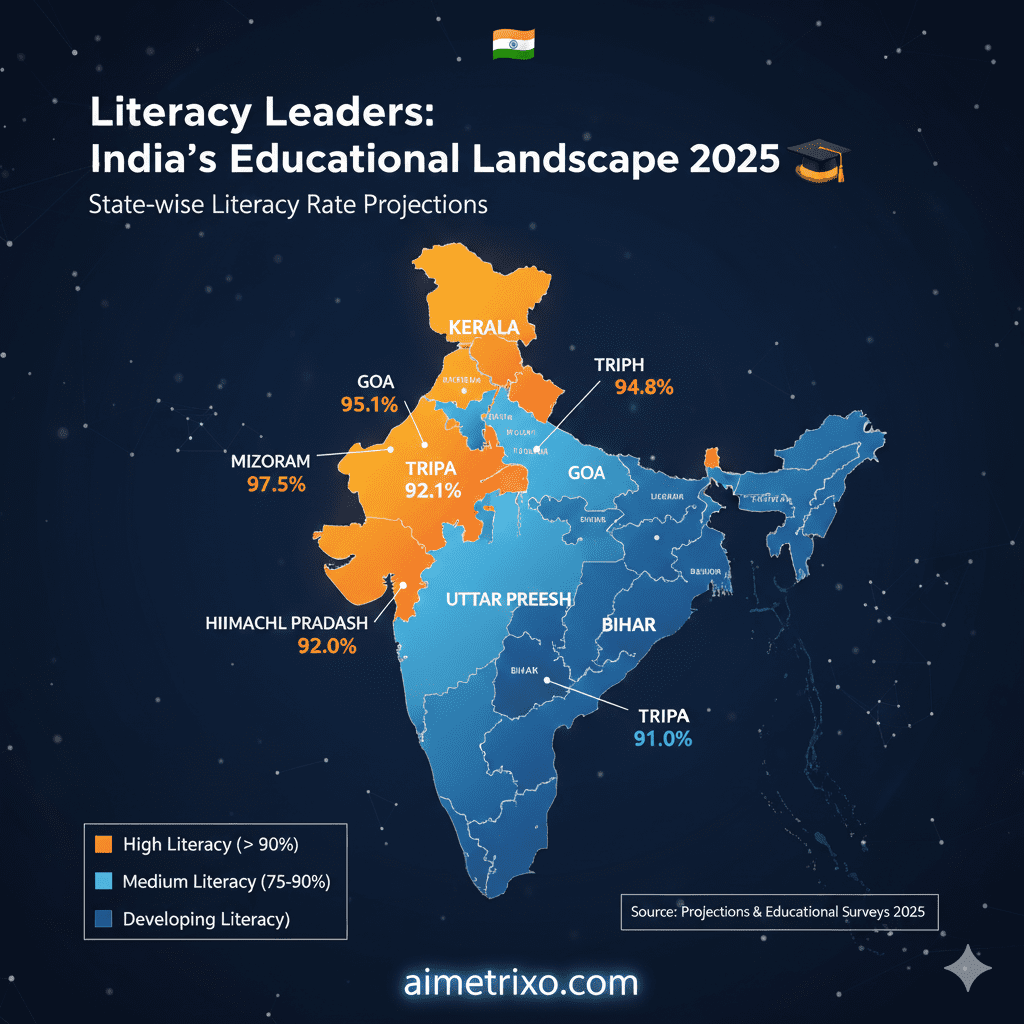
Literacy Leaders: States with High Educational Attainment 🎓
Certain states have consistently prioritized education, leading to high literacy rates and, consequently, a more skilled workforce. These states often become attractive destinations for industries requiring high-skill labor.
Expected Leaders for 2025 (based on consistent trends):
- Kerala: Consistently tops the literacy charts, a testament to its long-standing focus on education and social welfare programs.
- Mizoram: A smaller northeastern state that has achieved remarkable literacy rates through concerted efforts in education.
- Goa: Benefits from a strong education system and smaller population density.
- Tripura: Another northeastern state with a high literacy rate, reflecting focused government initiatives.
- Himachal Pradesh: Known for its strong rural education infrastructure and community participation.
Challenges and Initiatives to Boost Literacy
Despite overall improvements, significant disparities in literacy persist, particularly concerning gender gaps and rural-urban divides in some states. Challenges include:
- Access to Quality Education: Especially in remote or economically disadvantaged regions.
- Infrastructure Gaps: Lack of adequate schools, teachers, and learning materials.
- Socio-Economic Barriers: Poverty and social norms can prevent children (especially girls) from attending or completing school.
Government programs like the Sarva Shiksha Abhiyan (SSA), Mid-Day Meal Scheme, and various digital literacy initiatives continue to play a crucial role in improving educational access and outcomes across the nation and to tackle the Indian States Economic Comparison 2025. States are also focusing on skill development programs to ensure that literacy translates into employable skills.
The Demographic Engine – Population Dynamics 👪
The population of a state is intrinsically linked to its economy. While a large population provides a massive workforce and consumer base, it also places immense pressure on resources, infrastructure, and public services. Our Indian States Economic Comparison 2025 must examine population trends to provide a complete picture of economic stress and opportunity.
Understanding Population and Economic Pressure
Population figures determine per-capita income (as seen in Part 2) and also influence consumption patterns, labor supply, and the necessary scale of government expenditure on health and education. The dynamics of population growth—especially the Total Fertility Rate (TFR) and population density—are key indicators of future economic challenges.
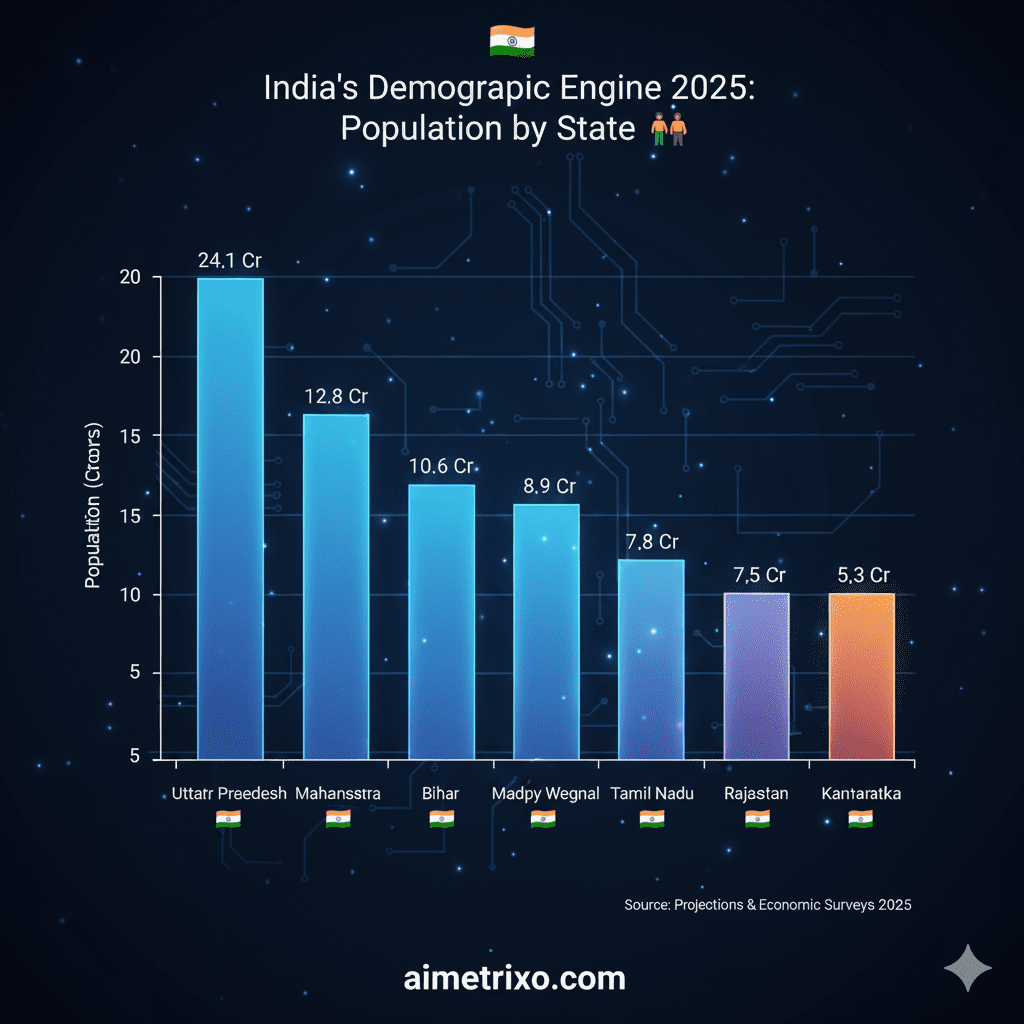
The Most Populous States: Uttar Pradesh and Bihar
For 2025, states like Uttar Pradesh and Bihar continue to lead the country in total population.
- Uttar Pradesh: Projected to remain the most populous state, its sheer size (estimated to be around 23.8 – 24.13 Crore people in 2025) provides an unparalleled market size and workforce potential. The challenge here is converting this large demographic into a skilled, productive workforce while managing high population density.
- Bihar: Projected to be the second or third most populous state, Bihar’s relatively high population growth rate places significant strain on its nascent industrial sector and limited resources, contributing to lower per-capita income figures.
Conversely, smaller states and Union Territories like Sikkim, Goa, and Lakshadweep have minimal populations, allowing them to achieve very high per-capita incomes and better human development indicators due to less strain on resources.
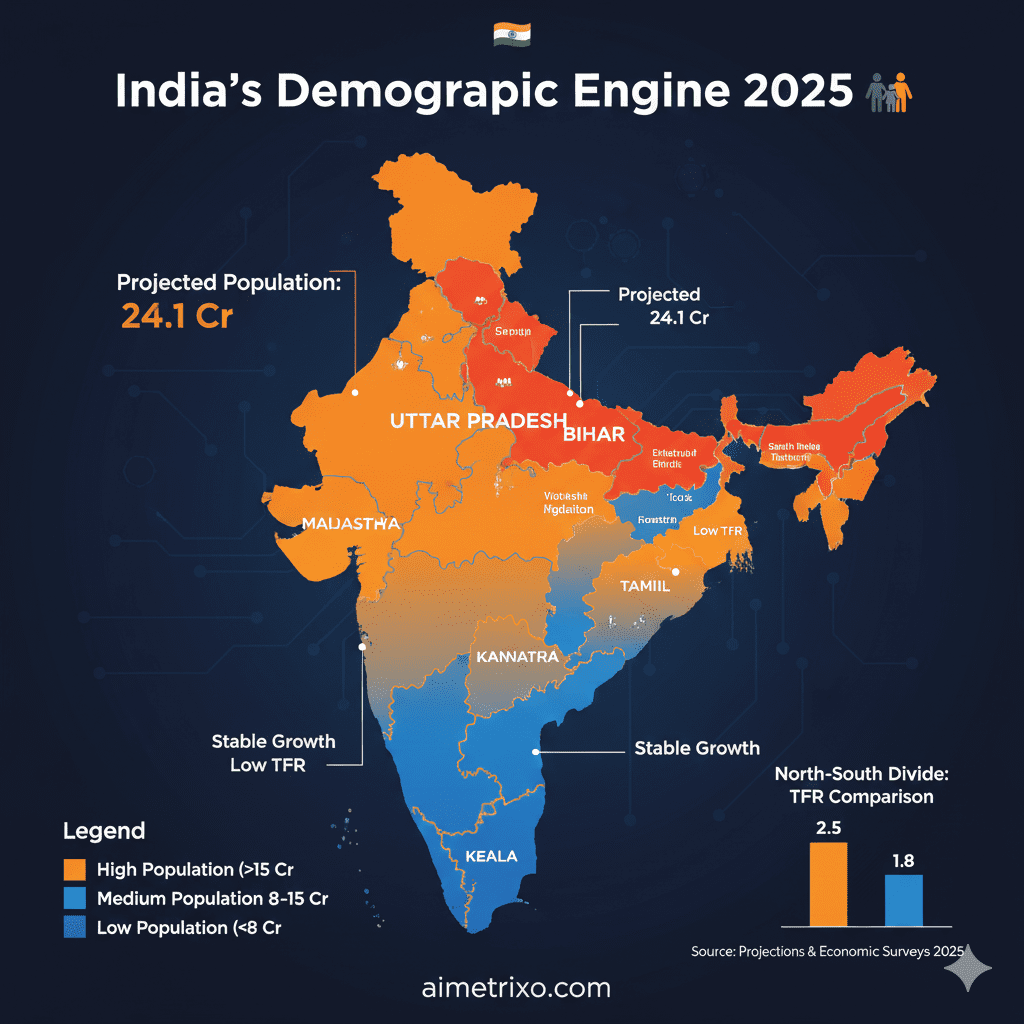
The North-South Divide in Demographics
A crucial trend in India’s population dynamics is the widening gap between the northern and southern states helps to understand the Indian States Economic Comparison 2025:
- Southern States (e.g., Kerala, Tamil Nadu): These states have achieved TFRs at or below the replacement level (2.1) for years, leading to stable or even slightly declining population growth. This demographic dividend allows them to focus resources on improving the quality of education and healthcare for an aging population.
- Northern States (e.g., Bihar, UP, Rajasthan): These states still exhibit higher growth rates, meaning a significant portion of their resources must be diverted to expanding basic infrastructure (schools, hospitals) for their rapidly growing young population. This difference in demographic momentum is a major factor driving the Economic Disparities in India.
For the most recent detailed projections on population and fertility rates by state, consult the National Family Health Survey (NFHS) data or reports from the Technical Group on Population Projections (under MoSPI): https://rchiips.org/nfhs/
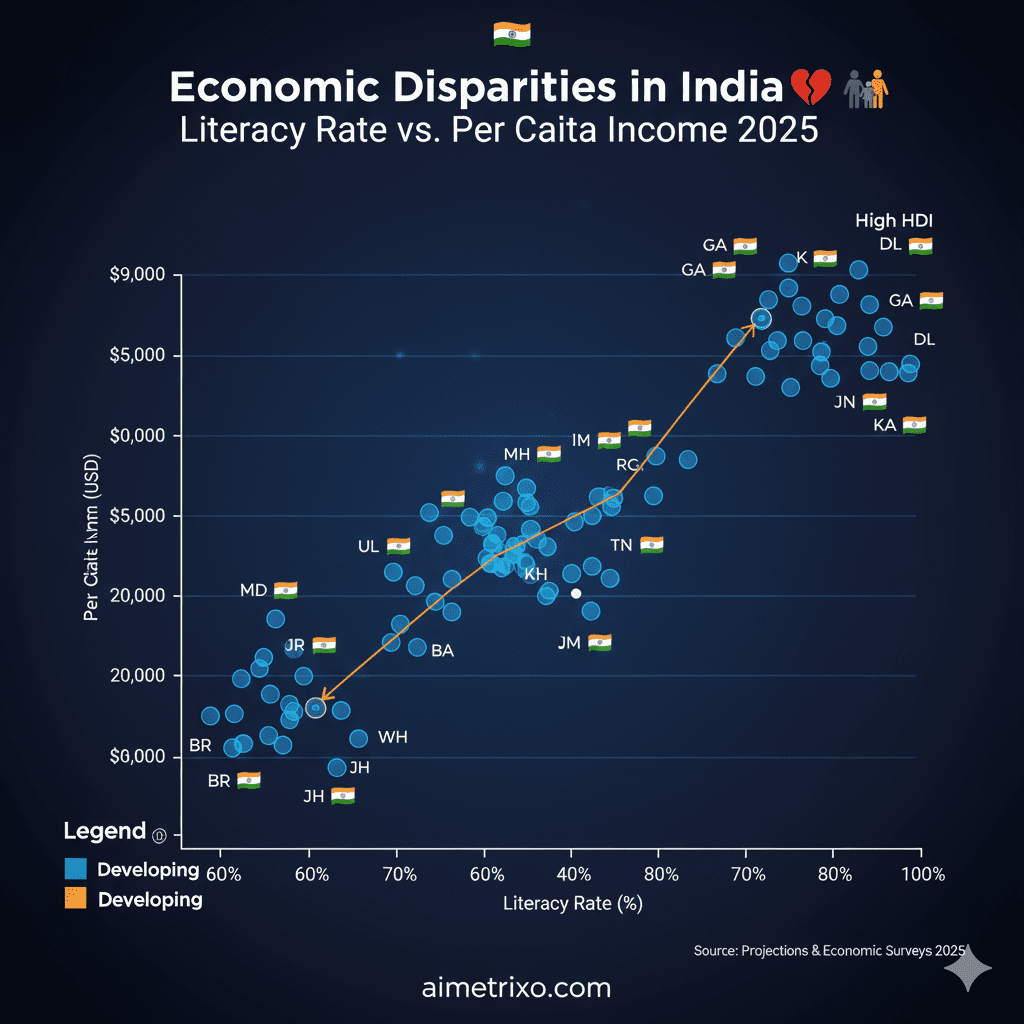
The Challenge of Disparity – Economic Disparities in India 💔
The core takeaway from the Indian States Economic Comparison 2025 is the persistent and, in some cases, growing economic disparity between states. These differences are not arbitrary; they are the result of historical factors, geographical location, resource endowments, and state governance quality.
The Vicious Cycle of Low Development
States that lag in one indicator often lag in others, creating a challenging feedback loop:
- Low Literacy $\rightarrow$ Low availability of skilled workers.
- Low Skilled Workers $\rightarrow$ Less attractive to high-value industrial/service investments.
- Low Investment $\rightarrow$ Lower GDP and fewer high-paying job opportunities.
- Low Per-Capita Income $\rightarrow$ Lower tax revenue for the state, limiting investment in education and health, thus restarting the cycle.
This is the central challenge in achieving inclusive national growth, where wealth creation is heavily concentrated in a handful of states.
The Role of Governance and Infrastructure
States that consistently rank high in economic indicators (Maharashtra, Gujarat, Karnataka) are also often leaders in the Ease of Doing Business (EoDB) rankings. Key elements of good governance that drive economic growth include:
- Swift Approvals: Reducing bureaucratic red tape for starting businesses.
- Land Availability: Implementing clear and transparent land acquisition policies.
- Law and Order: A stable environment that protects property rights and contracts.
- Infrastructure Investment: Aggressive investment in ports, highways, and logistics hubs (e.g., the dedicated rail freight corridors).
Focus Keyword Integration: The divergence in Indian State GDP Ranking 2025 is heavily influenced by the speed and effectiveness of state-level reforms and infrastructure projects.
Looking Ahead – Drivers of Future Growth 🎯
The road map for India’s economic growth is heavily dependent on addressing the regional imbalances highlighted in this Indian States Economic Comparison 2025. Here are the major drivers that will shape the economic landscape up to and beyond 2025:
1. Infrastructure-Led Growth (Gati Shakti)
Central government schemes like the PM Gati Shakti National Master Plan aim to break down silos between infrastructure planning and implementation across different ministries and states. By creating seamless connectivity across road, rail, air, and waterways, this initiative directly tackles the geographical barriers that suppress economic activity in landlocked or poorly connected states. This will directly boost industrialization and GSDP growth in states currently lagging behind.
2. Manufacturing & PLI Schemes
The Production-Linked Incentive (PLI) Schemes are designed to attract large-scale investment in key sectors (like electronics, pharmaceuticals, and automobiles) and boost domestic manufacturing. States that successfully implement these schemes and offer the necessary land and power infrastructure (e.g., Tamil Nadu, Gujarat, Andhra Pradesh) will see a disproportionate rise in their GSDP and job creation. This is a critical factor influencing the Indian State GDP Ranking 2025.
3. Digital Economy and Skilling
The rapid digitization across finance (UPI), governance, and commerce creates immense opportunities, particularly for service-driven states. However, for all states to benefit, investment in digital literacy and advanced skill development is vital. States with higher existing Literacy Rate in Indian States 2025 are better positioned to capitalize on this digital wave.
4. Urbanization Management
The growth of mega-cities (Mumbai, Delhi, Bengaluru) is putting pressure on metropolitan areas. Smart, decentralized urbanization strategies—developing secondary cities and industrial clusters outside the traditional capitals—will be key to distributing wealth and improving the average Per Capita Income India State Wise 2025. States like Maharashtra and Tamil Nadu are actively pursuing this decentralization.
Conclusion — AI is the multiplier
The Indian States Economic Comparison 2025 identifies clear winners and laggards — but the decisive factor going forward will be AI adoption and data governance. States that pair infrastructure and policy with AI-driven planning, precision agriculture, digital health, and skill-mapping programs will accelerate per-capita incomes and narrow regional disparities faster than those relying solely on traditional levers. Look for states that combine PLI/ Gati Shakti investments with AI pilots and skilling drives — they will lead India’s journey toward a $5 trillion economy.
Want a short checklist to audit how “AI-ready” a state is? Tell me which state and I’ll build it for you.
🤖 How AI & Smart Tech Are Rewriting State Growth (Actionable Examples)
Artificial Intelligence is already embedded into how states plan, pay and perform. Below are concrete ways AI is changing the numbers you see in this article.
1. AI for Precision Agriculture & Farmer Income
AI models + satellite imagery + local weather data enable precision advisories (when to sow, irrigate, spray) and accurate yield forecasts. When combined with PM-KISAN transfers and crop insurance, this raises farm productivity and reduces payout disputes.
2. AI in Crop Insurance (Faster, Fairer Claims)
Machine learning and remote sensing help insurers and gov portals quickly estimate crop loss area and severity — enabling PMFBY claims to be processed with fewer manual inspections and much faster turnaround times.
3. AI for Health & Public Services (Ayushman Bharat)
AI assists in patient triage, automated record checks, and fraud detection in claims — improving service delivery without proportionally increasing budgets in district hospitals and primary health centres.
4. AI-Driven Skill Mapping & Employment (Raise PCI)
States using AI to map workforce skills and industrial demand can design targeted skilling programs that raise employability and per-capita income more efficiently.
5. AI in Governance & Infrastructure (Smarter Gati Shakti)
Combining GIS, traffic/flow data and AI forecasting helps governments prioritize projects that yield biggest economic returns — fast-tracking industrial clusters and improving ease-of-doing-business.
6. Data + AI for Education (Literacy → Employability)
Adaptive learning platforms powered by AI convert basic literacy into job-ready skills faster — a key lever for states with lower human capital.
Takeaway: States that pair traditional policy (infrastructure, PLI) with aggressive AI & data governance will be the fastest climbers in the Indian State GDP Ranking 2025.
Discover Us More
It’s nice. Keep it up.
The comparison is really helpful
Pingback: Best Saving Schemes in India comparison: The 2026 Guide